|
Executive Summary
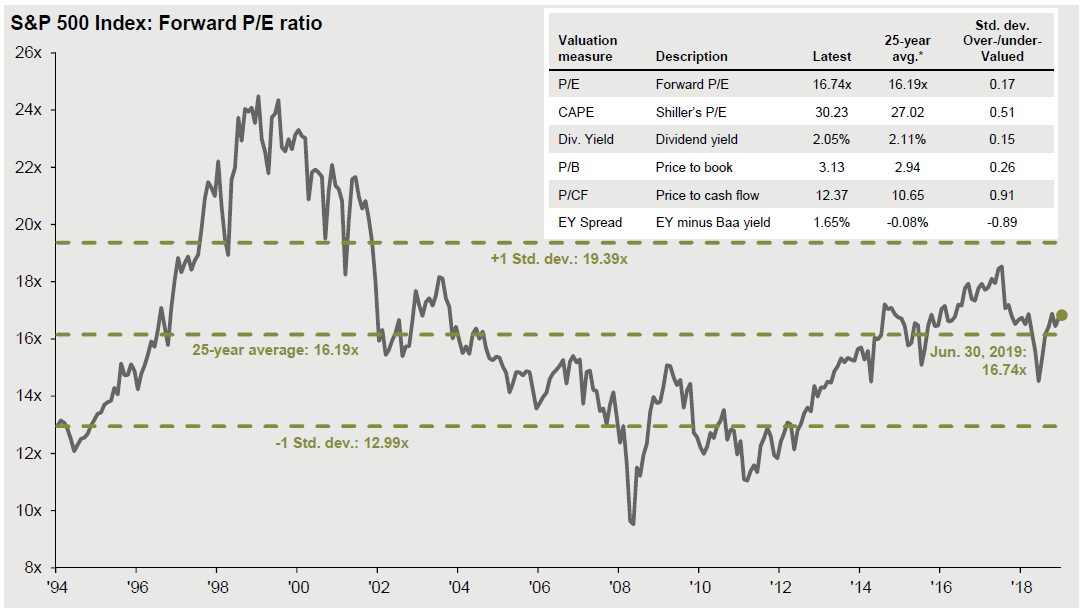
- The stock market seems surprisingly fit given that the current economic expansion is entering its 11th year and is now the longest on record. US stocks returned 4.3% in Q2 2019 and are up 18.5% year-to date.1 Although prices as a multiple of forward earnings are fully priced, the multiple is not really higher than it has been on average for the last five years (16.5x).2 Earnings growth has recently slowed to a crawl, but it is nevertheless growing, and the prospect of continued low interest rates holds out hope that stock prices can continue to climb this year.
 Source: J.P. Morgan, Guide to the Markets Q3 2019 Source: J.P. Morgan, Guide to the Markets Q3 2019
- In contrast to the optimism of the stock market, the inverted yield curve and pricing of bond futures suggest the bond market believes the economy will soon falter, requiring the Federal Reserve ("the Fed") to support it with rate cuts. This is a sharp about-face given that as recently as six months ago the Fed and the market expected rates to continue to gradually climb. It is challenging to point to a compelling change in underlying economic growth data to support such a sharp reversal in rate policy.
- Market volatility will likely be higher going forward than investors have recently grown to consider typical. “Jawboning” (i.e., talking markets up or down without any actual change in policy) used to be reserved as a monetary policy tool used by the Fed to help manage markets. It now also seems to be also used as a fiscal policy tool to manage markets based on the likelihood of tariffs, causing markets to drop, only to suddenly jump back based on nothing more than a tweet from the US President with a more optimistic tone. By itself, the alternating tone of the Administration’s messaging would be enough to support expectations of higher volatility later this year, but it is hardly the only driver to support increased volatility in the near future. Leading economic indicators are pretty evenly split between those that contribute to and those that detract from growth. Any news associated with the updating of these indicators is likely to generate volatility. Other potential sources of volatility include uncertainty around oil prices and expectations for headline inflation that can rise and fall with concerns about a potential U.S. confrontation with Iran. Finally, given the long-lived rally, a tension may be developing between markets that have been propelled forward by momentum, being stretched to extremes in terms of relative values, creating uncertainty about the timing of changes in market relationships.
- The outlook for stocks continues to be better than for bonds. Given how low nominal and real interest rates are, investors have few alternatives but to continue to invest in stocks. Stocks are also expected to benefit from earnings that are growing, albeit much slower than earlier this year, and corporate share buyback programs have the potential to grow earnings-per-share going forward as they have in the past. While US economic growth is uneven, the inverted yield curve aside, there is nothing that points to a recession that would cause concern of a sharp and extended drop in stock prices.
 Source: J.P. Morgan, Guide to the Markets Q3 2019 Source: J.P. Morgan, Guide to the Markets Q3 2019
- Given the likelihood of increased market volatility, it would be best to diversify investment portfolios as broadly as possible. The difference in return between value and growth stocks is at an extreme. Similarly, to the relationship between US and international stock valuations make international stocks seem much more attractively valued and the return difference between large cap and small cap stocks seems similarly stretched. Since these distorted relationships have been true for several years now, at this point such warnings may be perceived by investors as “cries of wolf. The many cross-currents playing out in the market make it difficult to predict what sectors will benefit when market dynamics change.
Background
Global economic growth has unquestionably slowed. This is frequently blamed on the uncertainty created by tariffs and trade disputes, but given that we are now late in the longest economic expansion on record, slowing growth should hardly be a surprise. While tariffs are not to be singled out to blame for slowing growth, hobbling our suppliers and clients with tariffs only worsens a weak global growth environment. The IMF has slashed its growth forecast for the eurozone and not only have export-driven economies, such as Germany’s, been particularly slowed, but the effects are now also starting to spread out to their neighbors.
Source: J.P. Morgan, Guide to the Markets Q3 2019
While the tariffs are also a drag on US growth, the US economy is less vulnerable than those of our trading partners because 80% of the US GDP is driven by domestic demand for its goods and services. Although US companies that derive a significant percentage of their revenues from outside the U.S. will likely be hurt more than more domestically-oriented companies, our economy overall will be harmed less than those of our trading partners. However, it is difficult—if not impossible—to analyze US markets outside the context of what is happening globally. Global PMIs (Purchasing Manager Indexes that measure the prevailing direction of economic trends based on surveys of supply chain managers across a breadth of industries) in different countries have been falling each month for more than a year now with many now in a state of contraction, so it is clear that economic growth globally is slowing.
The market delivered a respectable return this quarter and an extraordinary return year-to-date in 2019. This can be explained by earnings-per-share continuing to grow since the start of the year as well as clouds lifting late in the quarter on the ability of the US and China to resolve their trade dispute. Just a few days before that, an accommodative statement by the FOMC also helped to propel stock prices higher. While investors often focus on the negative news and statistics, half of the US leading economic indicators support continued growth and with little or no inflationary pressure on the Fed, it is free to keep interest rates rate low, if that’s what it deems necessary to keep the US economic expansion going—which was perhaps the gist of its comments in June when it left the Fed Funds rate unchanged.
Equity market view
The current economic environment is still supportive of stock prices, although it is clear that earnings growth will be much slower in the near term than it has been to date. Earnings growth is very modest and has fallen dramatically year-over-year, but it is still growing and therefore still supportive for stock prices. Although the tailwind from US tax cuts is finished, investors should remember that fiscal policy remains highly stimulative due to the US government’s continued deficit spending and monetary policy is likely to be as accommodative as the economy requires. While investors are now deep into this long-lived market rally and are therefore on the lookout for possible reasons for concern, slowing earnings growth is providing that concern. But slow growth is not negative growth and neither should they assume that the downward trend in earnings growth will continue indefinitely until earning growth turns negative. Financial conditions in the U.S. remain loose and there are no signs that access to credit has constrained corporate borrowing, investment or growth.
Bond market view
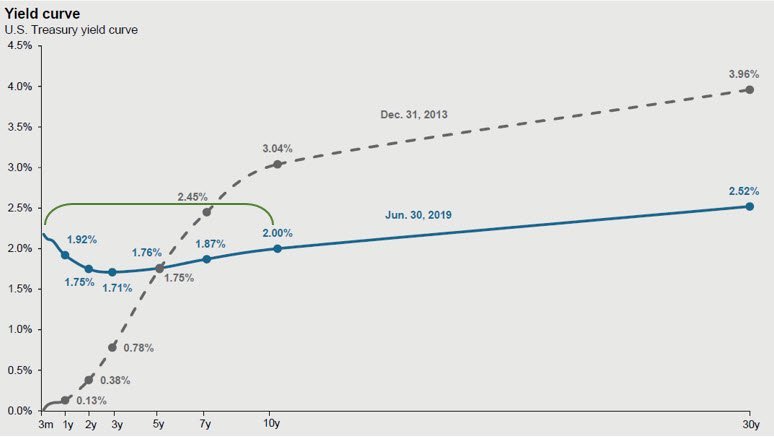
The bond market’s outlook for economic growth can be viewed as distinctly less optimistic than that of the stock markets’. Despite the already loose economic conditions and stimulative deficit spending mentioned above, the portion of the yield curve that has inverted now extends from three months to 10 years and bond futures pricing suggests that the market expects at least a 50 basis point decline in rates by the end of 2019.3
Source: J.P. Morgan, Guide to the Markets Q3 2019
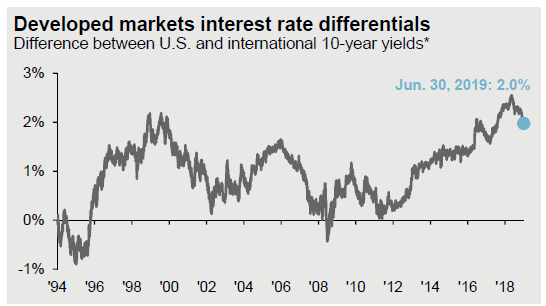
Understandably, investors might interpret this as the bond market expecting a recession that will prompt the Fed to cut rates to stimulate growth. In this interpretation, the stock and bond markets appear disconnected in terms of economic outlook. Having said this, the extended inversion of the yield curve may have less to do with investors’ outlook for the US economy than with supply and demand forces from foreign investors. For the reasons pointed out earlier, President Trump’s on-again, off-again tariff threats and generally more uncertain trade policy have far greater impact on our trading partners and their neighbors than they do on the US economy. As foreign central banks see their economies slowing they have begun signaling likely rate cuts. In reaction to the prospect of lower local bond yields, bond investors in these countries will likely increase their purchase of higher-yielding US bonds which pushes up US bond prices and pushes down US bond yields.
Source: J.P. Morgan, Guide to the Markets Q3 2019
Another possible way to reconcile what has been happening in the US stock and bond markets is that while expectations of growth have been slowing, expectations regarding future inflation have been falling even faster. If this is the case, then the stock and bond markets may not be disconnected. In fact this scenario, which has been observed in both the '80s and '90s, may support a continued increase in stock prices (or at least a soft landing for stock investors) as slower earnings growth is offset by the prospect of lower interest rates that allow for higher price multiples and the opportunity for corporations to continue to buy back their shares.
A third possible theory to reconcile stock and bond investor expectation is that the Fed is assumed to want to accommodate market expectations in order to not surprise investors, even if lower rates are not strictly required by economic conditions but are instead simply a remedy for the inverted yield curve by lowering short-term rates.
Volatility
With leading economic indicators split pretty evenly between those that contribute to and those that detract from growth, the economic outlook for the U.S. is delicately balanced and prone to volatility in reaction to the updating of the data underlying each indicator. Add to this the market’s swings between frustration and hope regarding the administration’s commitment to tariffs and the tension in market sentiment currently playing out between long-lived market momentum and the imbalance in relative asset values, and there are a number of good reasons to expect future market returns to be highly variable. Although we can imagine several scenarios that reconcile the seemingly conflicting economic outlooks of the stock and bond markets, investor uncertainty may stem from the belief that the bond and stock markets can’t be both “right”.
Market forecasting is always challenging but never more than when trends push relative valuations to extremes, because trends often overshoot historical ranges of typical relative values among asset classes and among market sectors. Relative valuations outside the range of what might be considered defensible relationships will eventually revert to their mean, but all investors should try to keep in mind that the timing of market reversals is frustratingly unknowable. Investors should try to remember John Maynard Keynes’ warning that, “The market can stay irrational longer than you can stay solvent.” Many trends have persisted for an extended period of time, thereby creating relative value imbalances (e.g. growth over value, domestic over international), but these warnings may sound to investors like advisors “crying wolf” given that the relative value imbalances have been in place for the last few years.
Market Outlook
Just as good news easing about the prospect for trade tensions with China and the likelihood of rate cuts by the Fed helped to spur stock prices, so “bad news” on trade, Iran, Brexit or interest rates could lead global and US stock prices to suddenly backslide. Much is made by some investors of the market’s view of what the Fed is likely to do but, as analysts from Deutsche Bank and Goldman Sachs have recently pointed out, the market is frequently wrong about what the Fed is likely to do. While my view is that the environment continues to be constructive for stocks, albeit with much slower and uneven appreciation than we’ve seen over last decade, there is enough uncertainty possible for “news” that could positively or negatively surprise investors that our confidence level around our expectation is unusually low.
Portfolio Positioning
Diversification is always good advice but never more than in market environments where 1) momentum has pushed markets to extremes in terms of relative valuation and 2) when government intervention (be it central banks, Presidents/national leaders, or both) are pushing markets in directions that are potentially contrary to what markets might otherwise do on their own given the exact same circumstances. Also, our slow-growth economy makes it fragile and highly sensitive to “surprises”. Since this has been the case for the last few years, with each year nevertheless bringing more of the same, investors can be forgiven for making such observations about the potential value of global and sector diversification with a large grain of salt. Although US stocks have outperformed international stocks, growth stocks have outperformed value stocks, and larger cap stocks have outperformed smaller cap stocks for much of the past decade, a sudden shift in market leadership and relative asset values would not be surprising.
Finally, in unpredictable markets like these, the best guidance we might be able to provide investors may be to challenge them to think now about how they would change or even whether they would change their investment strategy if their fears of a stock market decline happened. It is easier when contemplating this as an abstraction to be reassured that the global economy is not dead, nor is its growth. Companies will once again resume their growth and as shareholders we can expect to share in those profits. Even though tweets, politics, and disappointing Fed expectations can create uncertainty for investors today, in the long run, their impact is fleeting on long-term economic growth across the world in which disciplined investors are likely to participate.
|